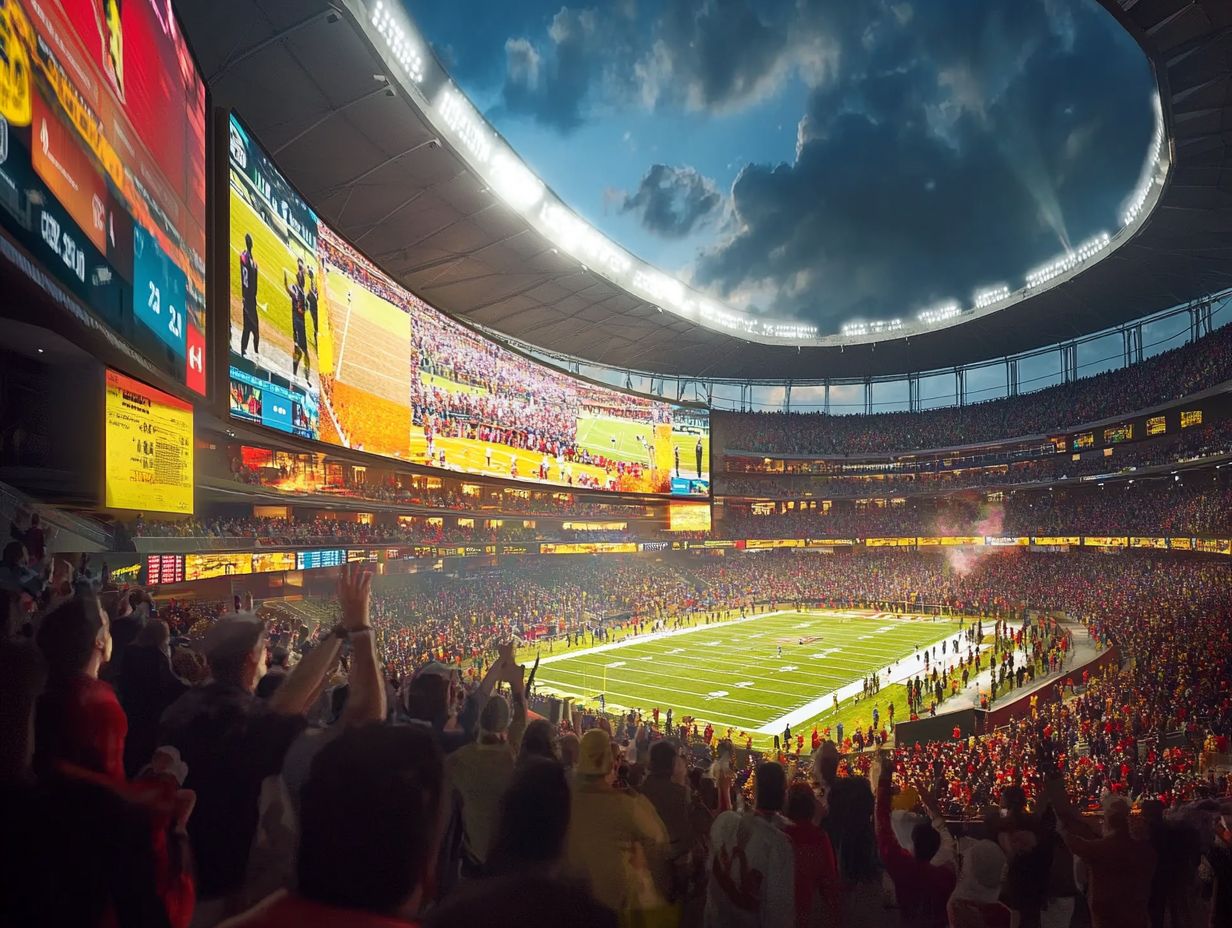
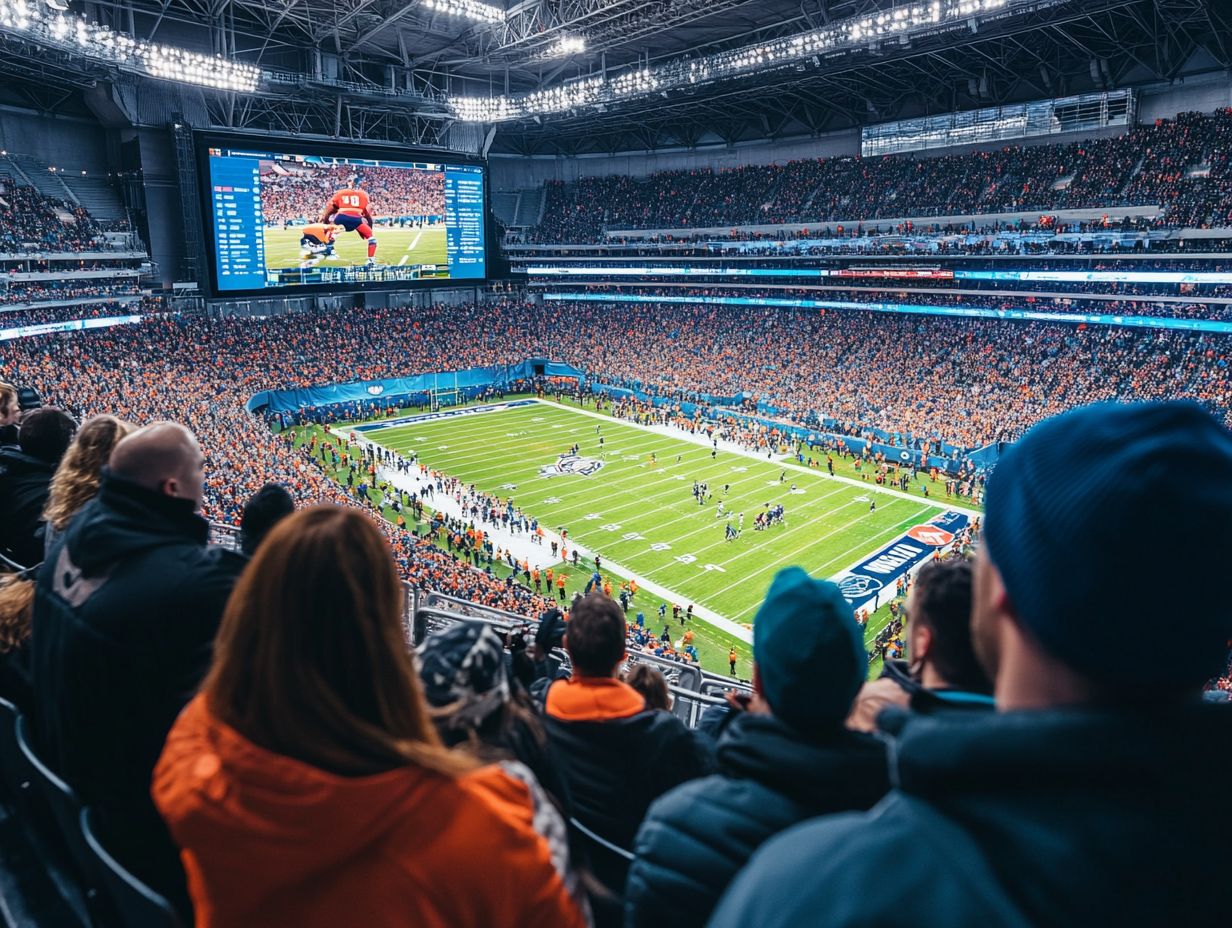
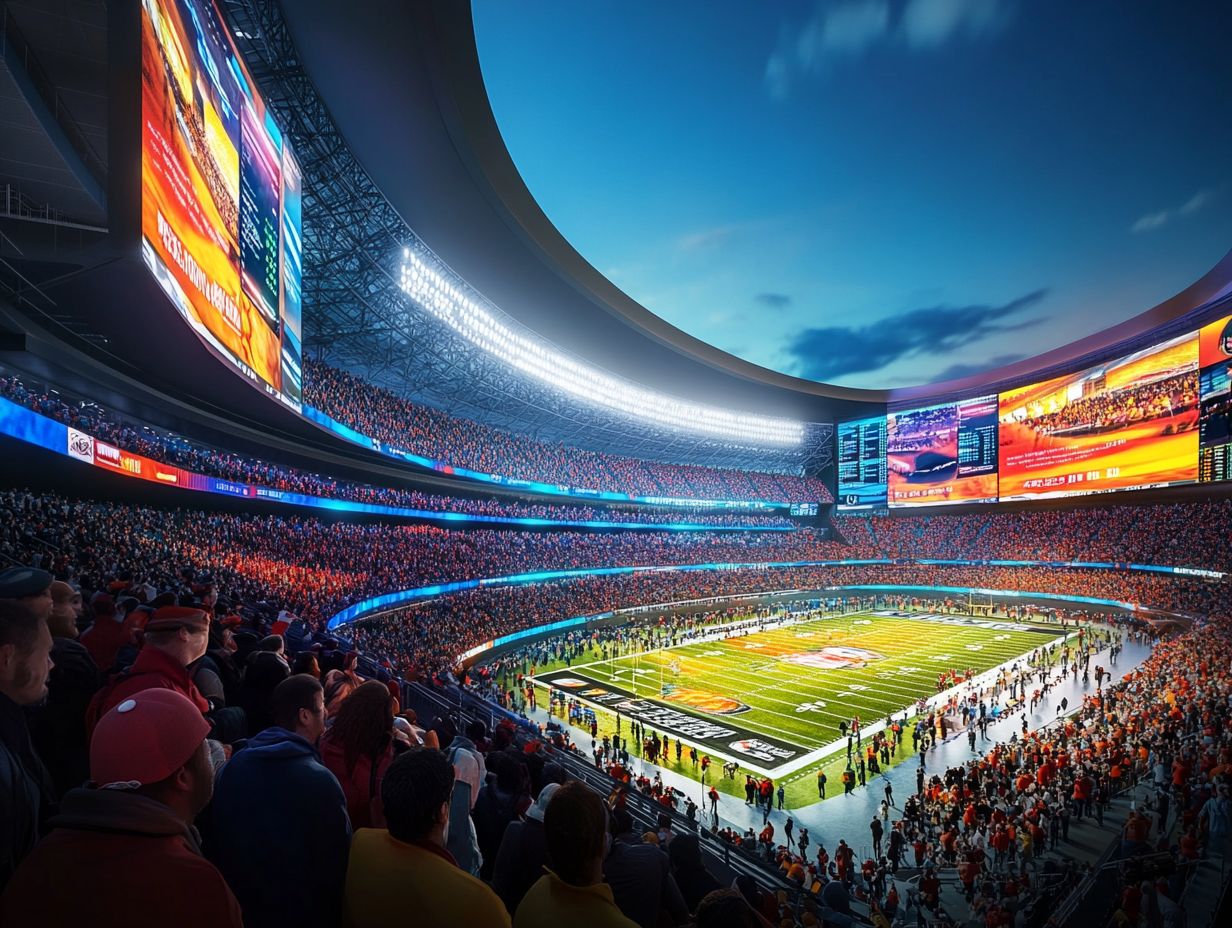
This piece covers the significance of measuring event popularity through foot traffic at sports events and explores how analytics can aid in decision-making and enhance fan engagement. We will examine various methodologies and technologies used to measure foot traffic, interpret key metrics, share relevant case studies, and discuss future implications along with recommendations for optimizing the experiences at sports events.
Definition and Importance in Sports Events

Definition: Measuring the popularity of sports events involves collecting and analyzing quantitative metrics related to attendance, engagement, and visitor behavior patterns through audience measurement and demographic analysis. This process helps assess the attraction and consumer profiles of these events.
Importance: Understanding the sports event popularity is crucial for their successful execution and long-term positive impact. This concept incorporates tools such as crowd analytics, location-based analytics, and venue analysis.
When combined with sports analytics and data analysis, sports organizations can enhance the effectiveness of their event marketing efforts and improve audience retention, ultimately resulting in a better game-day experience for fans.
These metrics also contribute to improved sponsorship valuations, increased audience attraction, and a higher overall return on investment (ROI) for events. More detailed analysis of crowd analytics, behavioral insights, and location-based insights allows teams to offer a more tailored experience for fans by properly allocating resources, whether it involves upgrading facilities, adjusting security protocols, or enhancing other aspects of the event atmosphere.
Moreover, analyzing athlete performance in conjunction with these metrics and understanding crowd dynamics can deepen fan engagement by enriching the narratives surrounding athletes. Ultimately, measuring popularity at sports events yields immediate benefits and fosters ongoing advantages for the community, as well as for the teams and organizations involved.
Benefits of Measuring Sports Event Popularity
Measuring the popularity of sports events offers numerous benefits that significantly enhance the overall execution of these events and the satisfaction of all stakeholders involved.
By analyzing metrics such as attendance and fan engagement through surveys, social media influence tracking, and ticketing data, organizations can gain valuable insights into their events and improve attendance predictions.
This data enables them to tailor event promotion and marketing strategies, including digital marketing and experiential marketing, ultimately increasing participation and fostering an optimal game-day experience. Additionally, success metrics are instrumental in evaluating potential sponsorship opportunities and understanding community engagement.
Informed Decision Making and Fan Engagement

Data analysis of sports events enables knowledge-based decision making regarding organizational strategies aimed at enhancing fan engagement and loyalty. By leveraging audience segmentation and real-time analytics, event planners can develop tailored marketing strategies that resonate with diverse fan segments, thereby improving their overall experience.
This approach not only fosters stronger community relationships but also increases brand visibility and supports the implementation of long-term engagement initiatives.
For instance, teams utilizing mobile analytics and mobile tracking technologies can gain valuable insights into fan behavior and preferences, allowing them to deliver effective promotional campaigns.
One specific sports franchise employed qualitative analysis to segment its audience based on audience demographics, purchasing behaviors, and social media interactions. With this data, they successfully implemented targeted campaigns that boosted attendance at games and increased merchandise sales.
This illustrates that when organizations better understand their audiences through demographic segmentation, they can create more memorable and meaningful experiences, leading to deeper fan loyalty and improved engagement metrics.
Methods of Measuring Foot Traffic at Sports Events
Measuring foot traffic at sports events involves a range of innovative methods that utilize advanced technology and data collection techniques. Foot traffic analytics can be conducted through mobile analytics, foot traffic heatmaps, and traffic flow analysis, which track and gather real-time data on attendees’ movement patterns and engagement levels.
These methods provide valuable insights that help assess venue performance, enhance operational efficiency, and improve the overall game day experience for fans. Ultimately, understanding foot traffic trends and visitor flow is essential for effective event scheduling and maximizing return on investment (ROI) for events.
Technologies and Tools Used

Technologies and tools utilized for foot traffic analytics in sports events encompass data collection, spatial data, and processing technologies that facilitate data interpretation.
Mobile tracking solutions enable organizations to not only gather data but also process it in real-time, helping with the management of large crowds. Geographic Information Systems (GIS) and geolocation data play a crucial role by mapping the geographical movement of attendees within a venue, which helps organizations optimize venue layouts and direct foot traffic toward and away from specific areas of a stadium.
Additionally, predictive modeling software allows organizations to forecast behaviors based on historical foot traffic data. A case study published by the Event Safety Alliance demonstrated how one stadium successfully implemented mobile tracking, GIS, and predictive modeling technologies to significantly enhance operational efficiency during a championship event.
Furthermore, data visualization tools aid stadium stakeholders in comprehending the information collected from these technologies, enabling them to make quick adjustments that lead to increased visitor satisfaction and reduced wait times, thus improving venue optimization.
Interpreting Foot Traffic Data
Interpreting foot traffic data is crucial for assessing the success of sports events and ensuring their continued viability. By focusing on key performance indicators (KPIs) such as audience retention and crowd analytics, organizations can measure visitor engagement and understand the relationship between their events and the surrounding environment.
Data analysis offers valuable insights into how foot traffic influences event marketing, sponsorship effectiveness, visitor engagement, and overall venue performance.
Key Metrics and Their Significance

Key metrics in foot traffic analytics are crucial for understanding visitor behavior and engagement levels during sports events. Three important metrics—attendance tracking, engagement metrics, and real-time insights—provide invaluable information for market research and sponsorship valuation. These metrics enable event organizers to make informed decisions about ticket pricing strategies and significantly enhance the overall visitor experience, contributing to event success factors.
For instance, attendance metrics and tracking help identify peak times during an event, allowing organizers to manage crowds effectively and determine when to introduce additional attractions to boost community involvement. Engagement metrics, which encompass social media influence, interactions, and on-site feedback, serve as essential indicators of audience sentiment and preferences, making them vital for evaluating event success.
Real-world examples from the foot traffic analytics section highlight organizations that have successfully attracted and retained audiences by using these analytics to optimize vendor placements based on foot traffic patterns and visitor demographic profiling. These key metrics not only guide short-term strategies but also help build long-term relationships with attendees.
Case Studies and Examples of Foot Traffic Analytics in Sports Events
This section presents case studies and real-life examples of foot traffic analytics in sports events. These examples provide valuable insights into consumer behavior and event-related spending, offering guidelines for enhancing event management.
By examining successful instances of foot traffic analytics, organizations can glean important lessons regarding sponsorship effectiveness, community engagement strategies, and the economic impact of events.
The following examples highlight the significance of data-driven decisions in improving the fan experience, enhancing event branding, and ensuring the success of events.
Real-life Applications and Results
Real-life applications of foot traffic analytics have produced impressive results, highlighting the potential of data-driven decision-making in sports events. Organizations have leveraged data visualization techniques to depict audience demographics and engagement trends, which has led to improved event promotion, social influence, and operational efficiency.
By conducting qualitative and marketing analytics, along with gaining insights into visitor behavior, event planners can create personalized experiences that resonate with diverse fan bases, ultimately increasing overall satisfaction.
For instance, a recent music festival employed foot traffic analytics to gain a deeper understanding of attendee flow during peak hours. By analyzing movement patterns and transportation patterns, the organizers identified bottlenecks near food stalls and reconfigured layouts to enhance accessibility. As a result, overall visitor engagement metrics improved, with a 20% increase in food and beverage sales during the event.
In another example, a sports venue utilized foot traffic data to segment its audience, enabling targeted marketing of merchandise to specific demographics based on their attendance patterns and venue capacity. This strategic approach not only boosted revenue generation but also strengthened the emotional connection between fans and the brand, ultimately enhancing long-term loyalty.
Future Implications and Recommendations
The future implications of foot traffic analytics in sports events are significant, particularly as new trends emerge in the industry, including audience measurement and awareness of event sustainability continues to grow.
By utilizing predictive modeling, data visualization, and focusing on stakeholder engagement, organizations can more effectively anticipate fan needs and enhance overall fan engagement.
These strategies collectively provide sports organizations with a long-term vision for their events while promoting a more sustainable approach to event management, including event impact and community engagement.
As technology advances, sophisticated analytics dashboards will offer real-time insights into crowd behavior and foot traffic patterns, enabling venues to streamline operational flow and enhance visitor experiences.
Innovative organizations should prioritize community engagement as a key component of their strategy, fostering local partnerships that support sustainability, shared prosperity, and economic impact.
By embracing these future trends, sports organizations can not only improve their monitoring of foot traffic but also employ event forecasting and demographic segmentation to create a positive impact on their surroundings, ensuring their events are both memorable and environmentally responsible.


